Bitcoin Price Update: May 15, 2024


Hey there, crypto enthusiasts! Today, we’re bringing you a quick update on the daily and hourly price action of Bitcoin (BTC). Let’s dive into the charts and see what’s been happening with the world’s leading cryptocurrency after CPI data was
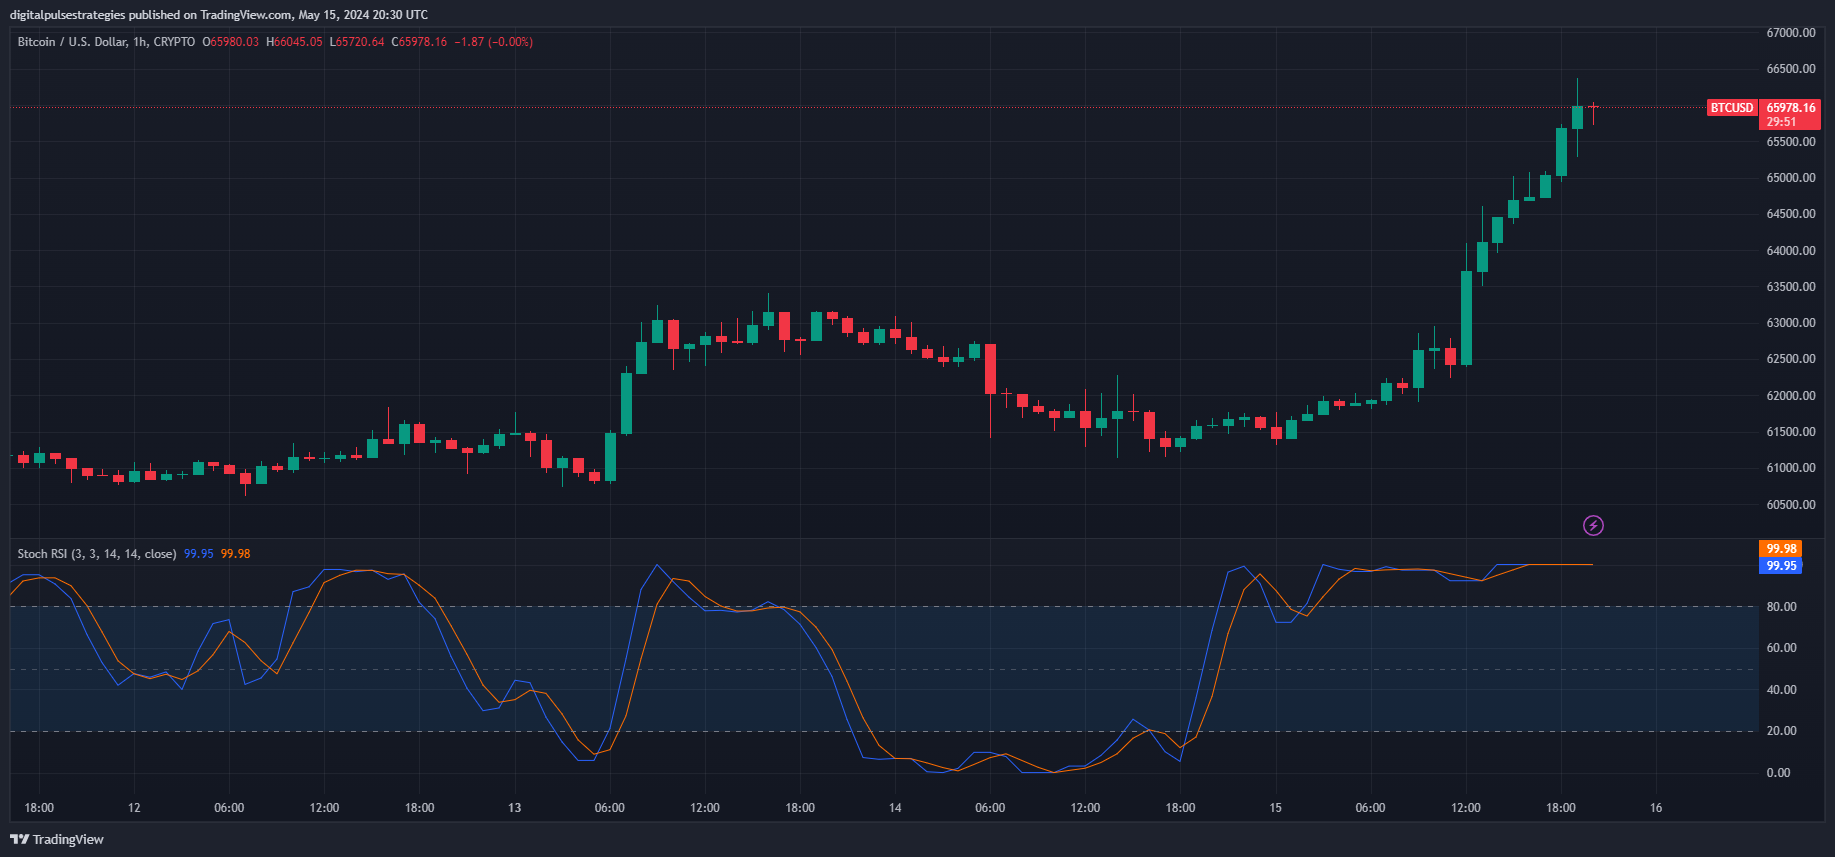
Hourly Price Chart Analysis
Looking at the hourly BTC/USD price chart, we can see some significant movements:
- Current Price: Bitcoin is trading at around $65,978.
- Recent Highs: BTC reached a peak of $66,045 before facing some resistance.
- Stochastic RSI: The Stoch RSI is extremely high, currently showing values of 99.95 and 99.98, indicating that Bitcoin is heavily overbought on the hourly timeframe.
Key Observations:
- Strong Uptrend: Over the past few hours, Bitcoin has shown a strong upward movement, indicating bullish momentum.
- Overbought Conditions: The high Stoch RSI suggests that Bitcoin may be due for a short-term correction or consolidation, as it has entered an overbought territory.
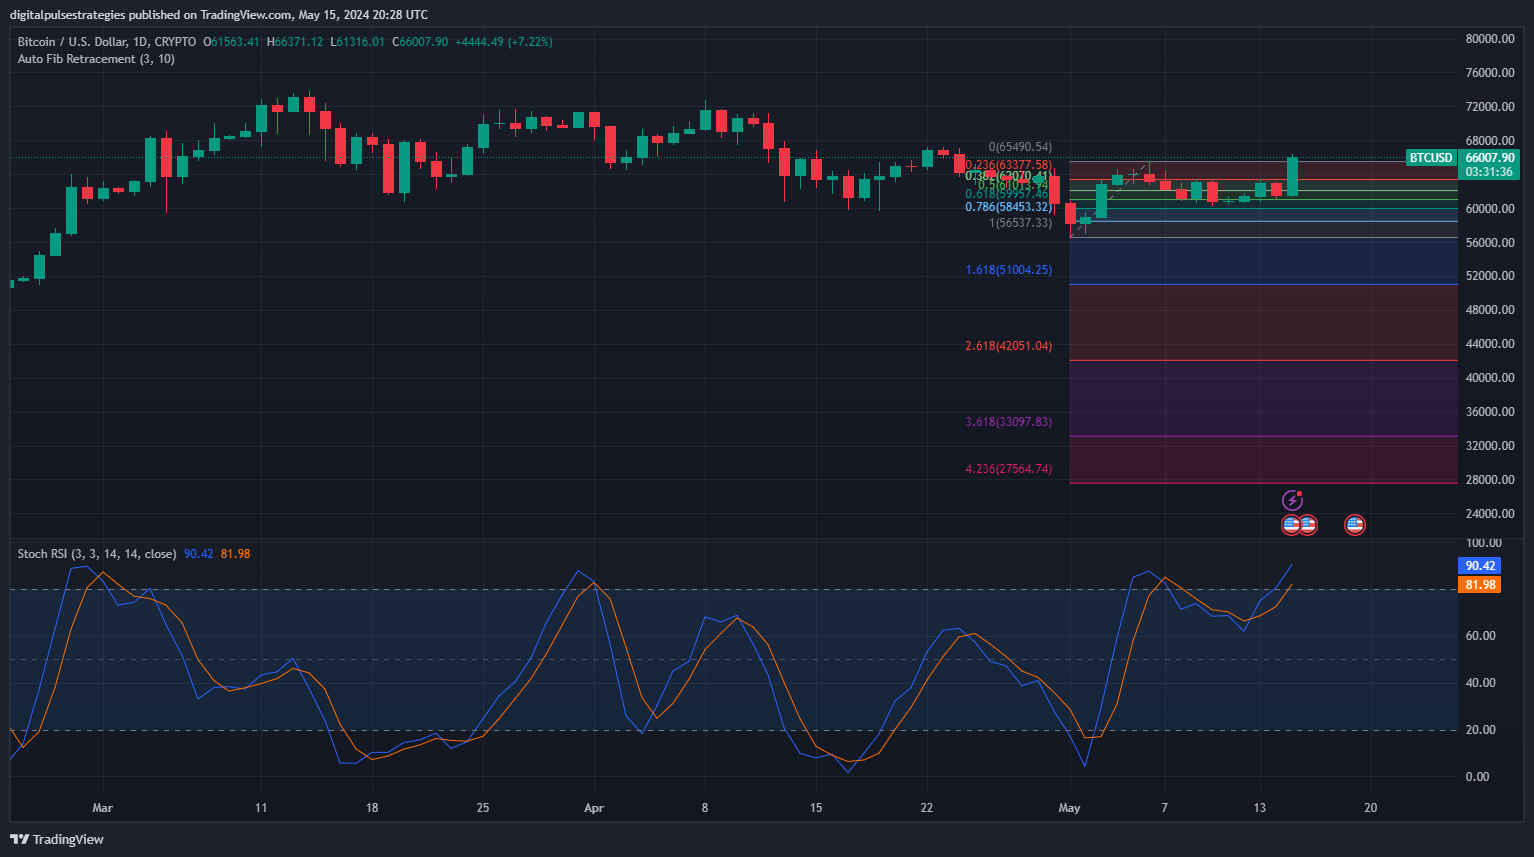
Daily Price Chart Analysis

Moving to the daily BTC/USD price chart, we observe the following:
- Current Price: Bitcoin is trading at around $66,000, showing a significant daily gain of 7.22%.
- Fibonacci Retracement Levels: The chart includes Auto Fib retracement levels, indicating potential support and resistance areas.
- Recent Low and High: The recent low was around $61,563, while the recent high was $66,371.
- Stochastic RSI: The Stoch RSI on the daily chart is also high, with values of 90.42 and 81.98, indicating overbought conditions on a larger timeframe.
Key Observations:
- Bullish Breakout: Bitcoin has broken above key resistance levels, pushing through to new short-term highs.
- Potential Resistance: The next resistance levels to watch are around the 0.786 Fibonacci retracement level ($65,453) and the recent high near $66,371.
- Overbought Conditions: Similar to the hourly chart, the daily Stoch RSI indicates that Bitcoin is overbought, which could lead to a pullback or sideways movement in the near term.
Conclusion
Bitcoin has shown impressive strength, rallying to the $66,000 mark and breaking through several resistance levels. However, both the hourly and daily Stoch RSI indicators are in overbought territory, suggesting that we might see some consolidation or a minor correction before the next leg up – When both time frames Stoch RSI’s agree, it’s hard to ignore that signal.
Stay tuned for more updates, and keep an eye on those support and resistance levels as Bitcoin navigates through these exciting times.
Happy trading, and see you in the next update!